Last Updated on
Google Sheets is a spreadsheet application developed by Google. It allows users to enter data into cells and then manipulate them using formulas and functions. The spreadsheet also supports charts and graphs.
There are two ways to create graphs (or charts) in Google Sheets. One way is through the built-in Chart Builder tool.
Another way is through the Data Visualization feature.
In this tutorial, we’ll show you how to create a bar chart in Google Sheets using the Data Visualization feature and the built-in ChartBuilder tool.
Let’s get started!
How To Build A Simple Chart
This tutorial will show you how to build a simple chart:
Step
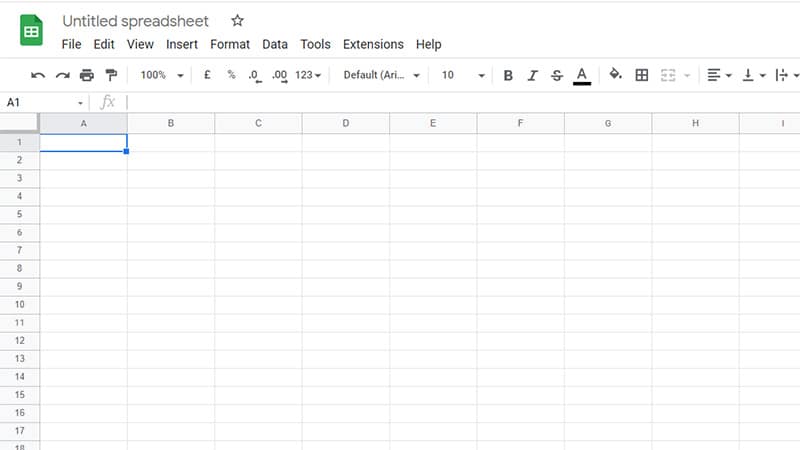
Open Google Sheets
First, we need to open our sheets.
Navigate to your Google Drive folder where you have saved the file. Select it and click Open.
Or, open a brand new Google Sheets file.
Before we can start, it is always best to have some information that you want to turn into a graph.
Have that ready on the Google Sheets.
Step
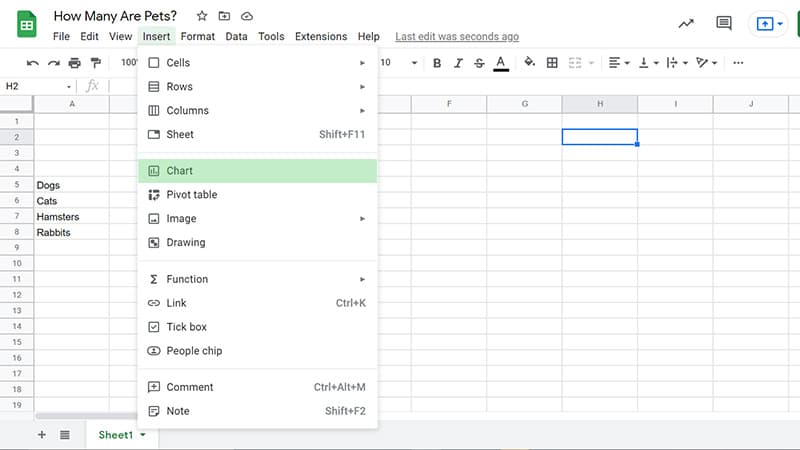
Click “Insert” Chart
Now that our sheet is open, let’s start creating a new chart. To do this, click “Insert” on the top menu and click “Chart”.
Step
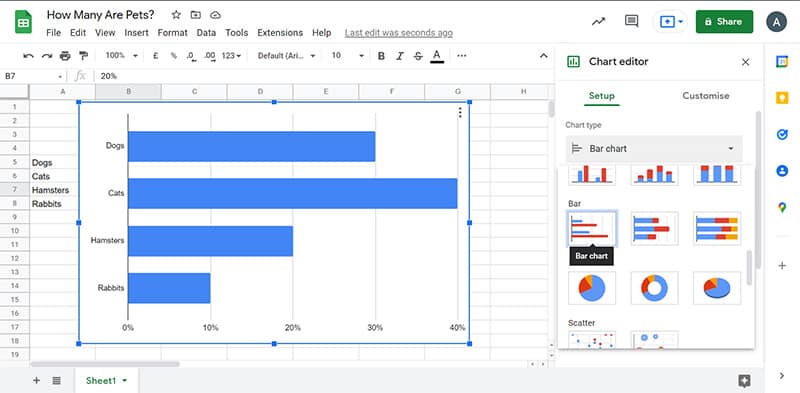
Change The Type Of Chart
Step
Change Its Size Or Placement
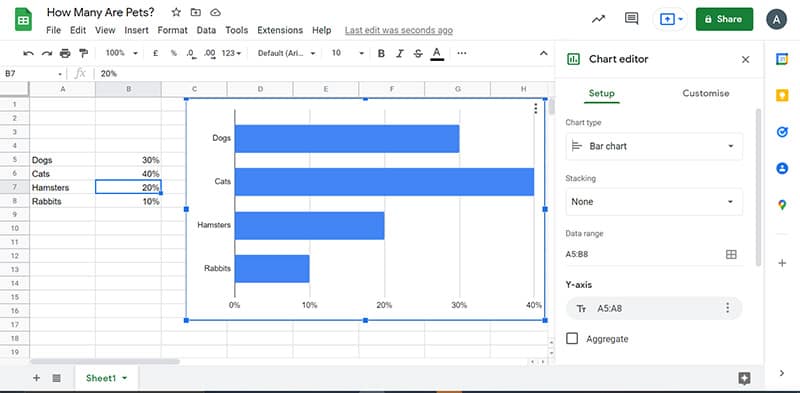
You can click on the graph and hold it to move it around the Google Spreadsheet, or edit its size by clicking on the chart and using the side arrows to make it bigger or smaller.
Step
Edit The Chart
By clicking on “Customize” you can edit the chart.
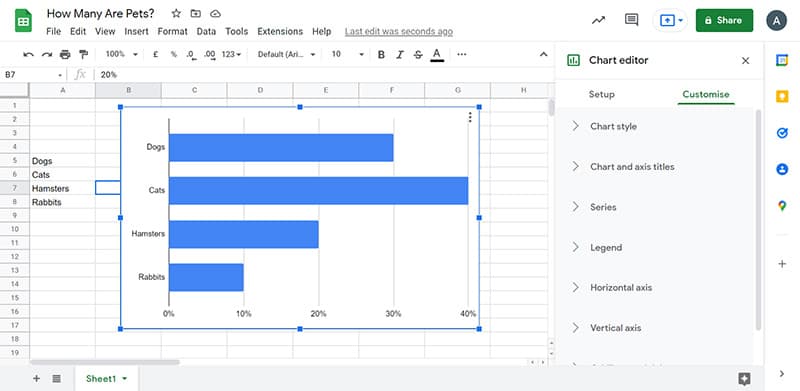
You can change the colors of the bars and the background, as well as make the bars smaller, make little detail changes, and so on.
Finally, let’s add a title to our chart. Click on the “Chart and Axis Titles”.
Here you can add your title, change its position and much more.
The final result should look like this:
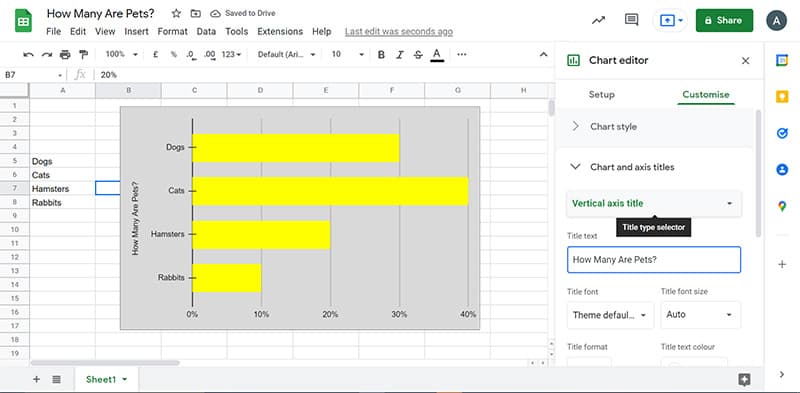
We’ve successfully created a bar chart in Google sheets. Next, let’s see if we can use the built-in Chart builder tool to create a similar chart. To do so, navigate back to our spreadsheet.
Why Is Using a Graph Important?
Graphs are used to represent data in many different ways, and they can be very useful for conveying information about the data.
A simple example would be that of a histogram which shows how often each value occurs within a set range.
This could be used to show the distribution of values within a population, or it could be used to show how often a particular value appears within a given period.
The other use of graphs is to convey relationships between variables. For example, if you were looking at sales figures for different products, you might want to see how much more profitable one product was than another.
You could do this by plotting the total revenue against the number of units sold (or vice versa), but you could also plot the two together on the same graph with a line showing their relationship.
Final Thoughts
Google Sheets has many powerful features. It’s easy to use and free. So, if you’re seeking an alternative to Excel, then try out Google Sheets.
You can easily create a graph with full customization using the simple method above.
From changing the colors, size, and small details, to choosing a number of ways to present your findings, there is a lot of choice within Google Sheets when it comes to graphs.


