
Early RTX 5070 Ti benchmarks appear online, here’s how much slower it is than the RTX 5080


Table of Contents
Nvidia has already announced the launch dates for its RTX 5070 and 5070 Ti GPUs, and the Ti variant is up first with a release later this week – February 20th. We’ll soon get to see detailed reviews for the card comparing and contrasting performance across the board, but for now, we can only rely on early benchmarks and Nvidia’s (mostly) DLSS-driven comparisons.
Early benchmarks are now starting to surface online for the RTX 5070 Ti. Unfortunately, there are no game benchmarks included in this leak, but we can at least have a look at an important synthetic test, and luckily, we’ve done the very same test on two different RTX 5080 GPUs – so let’s see how they compare.
Prime Day is finally here! Find all the biggest tech and PC deals below.
- Sapphire 11348-03-20G Pulse AMD Radeon™ RX 9070 XT Was $779 Now $739
- AMD Ryzen 7 7800X3D 8-Core, 16-Thread Desktop Processor Was $449 Now $341
- ASUS RTX™ 5060 OC Edition Graphics Card Was $379 Now $339
- LG 77-Inch Class OLED evo AI 4K C5 Series Smart TV Was $3,696 Now $2,796
- Intel® Core™ i7-14700K New Gaming Desktop Was $320.99 Now $274
- Lexar 2TB NM1090 w/HeatSink SSD PCIe Gen5x4 NVMe M.2 Was $281.97 Now $214.98
- Apple Watch Series 10 GPS + Cellular 42mm case Smartwatch Was $499.99 Now $379.99
- ASUS ROG Strix G16 (2025) 16" FHD, RTX 5060 gaming laptop Was $1,499.99 Now $1,274.99
- Apple iPad mini (A17 Pro): Apple Intelligence Was $499.99 Now $379.99
*Prices and savings subject to change. Click through to get the current prices.


- GPU: GB203
- CUDA Cores: 10,752
- VRAM: 16GB GDDR7
- Memory Bus Width: 256 bit
- Base Clock Speed: 2,295 MHz
- Boost Clock Speed: 2,790 MHz
RTX 5070 Ti and RTX 5080 compared in 3DMark
According to benchmarks posted by VideoCardz credited to “review media” with a Ryzen 7 9800X3D and 48GB DDR-6000 RAM setup, the RTX 5070 Ti is 16.6% faster than the 4070 Ti Super and 13.2% slower than the RTX 5080. This looks promising for the 5070 Ti compared to the 5080 considering its $749, but the fact there will be no Founders Edition models means it will likely be tough to find one at this price. However, these benchmarks aren’t official yet, so take them with a grain of salt.
| 3DMark benchmark | RTX 5080 | RTX 5070 Ti | RTX 4070 Ti Super |
|---|---|---|---|
| Speed Way (1440p) | 8,902 | 7,646 | 6,466 |
| Steel Nomad (4K) | 8,163 | 6,532 | 5,694 |
| Port Royal (1440p) | 22,034 | 19,045 | 16,024 |
| Time Spy (1440p) | 32,045 | 27,384 | 24,684 |
| Time Spy Extreme (4K) | 16,084 | 13,485 | 12,045 |
| Fire Strike (1080p) | 76,483 | 68,741 | 59,198 |
| Fire Strike Extreme (1440p) | 41,192 | 35,483 | 29,934 |
| Fire Strike Ultra (4K) | 21,256 | 18,065 | 14,435 |
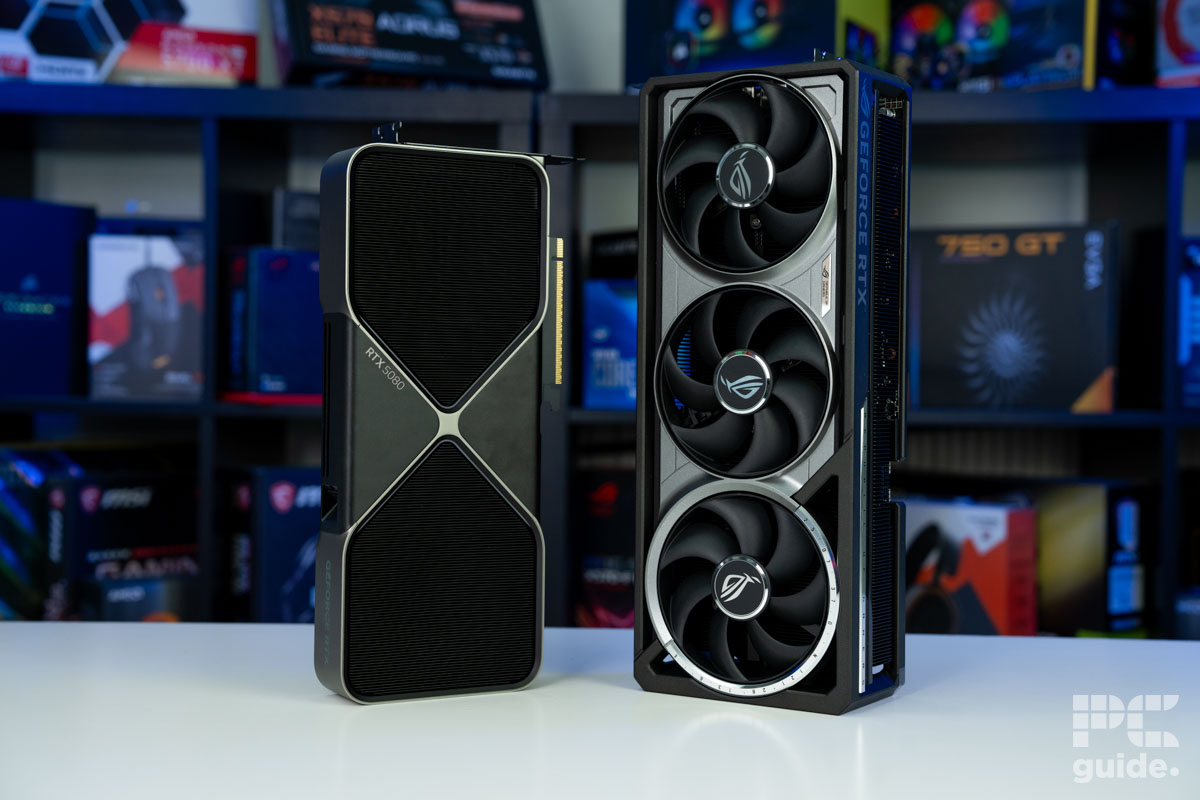
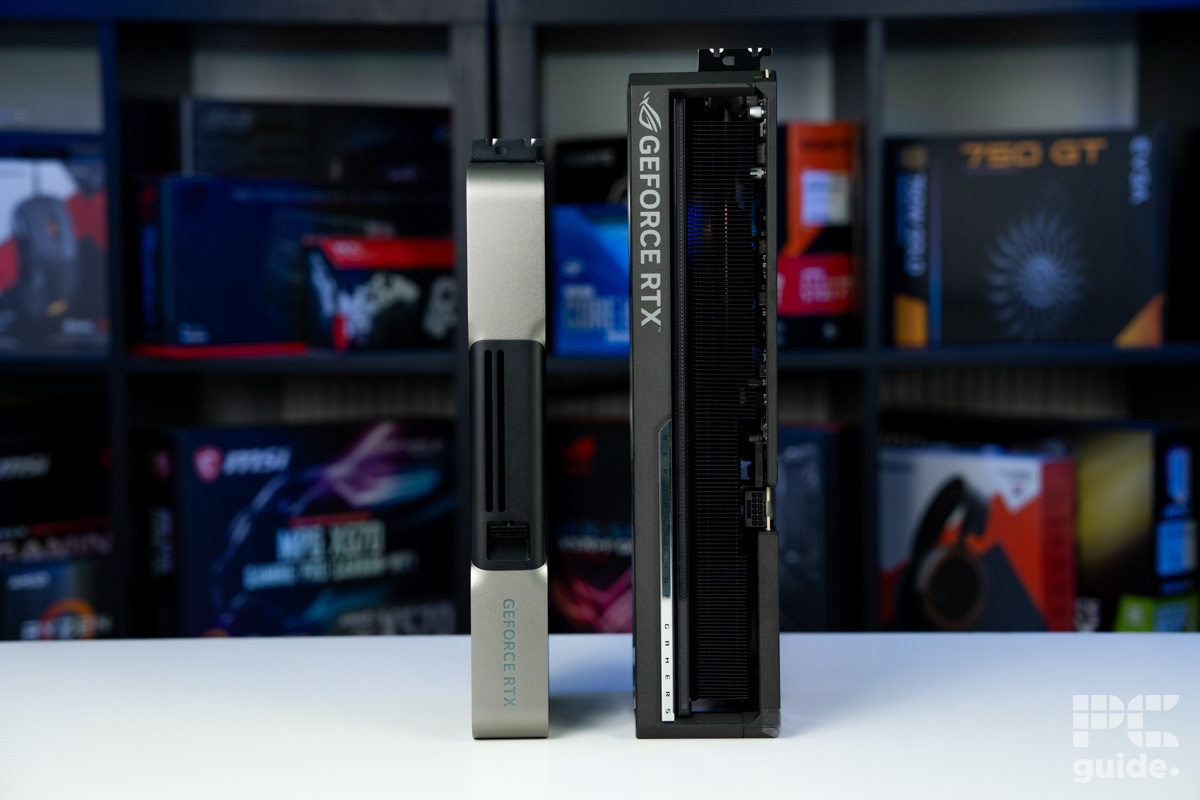
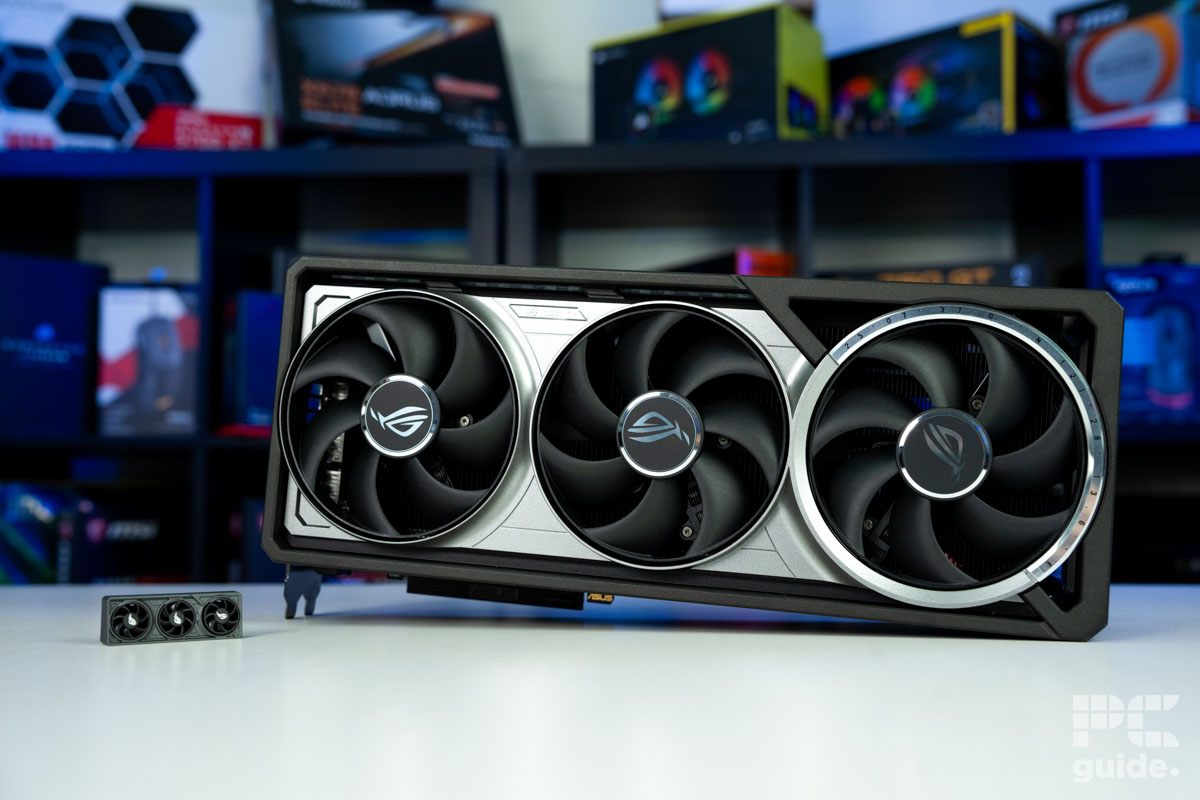
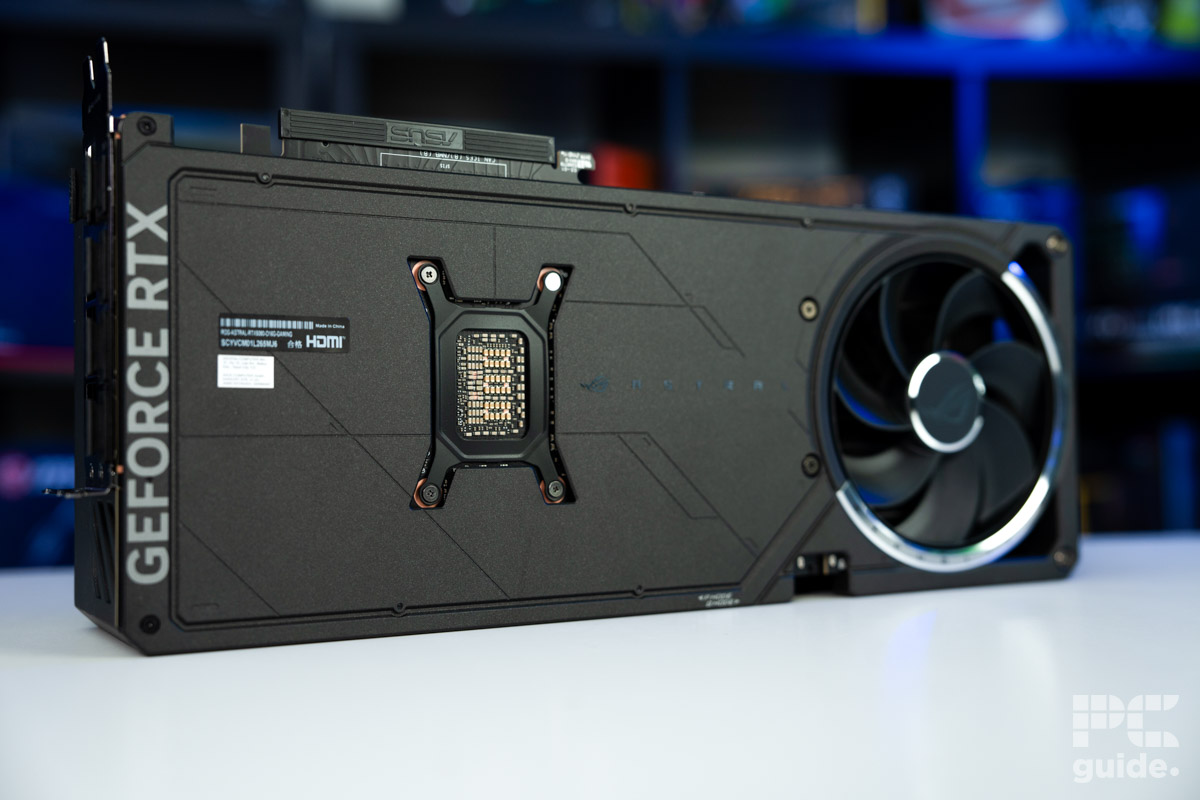
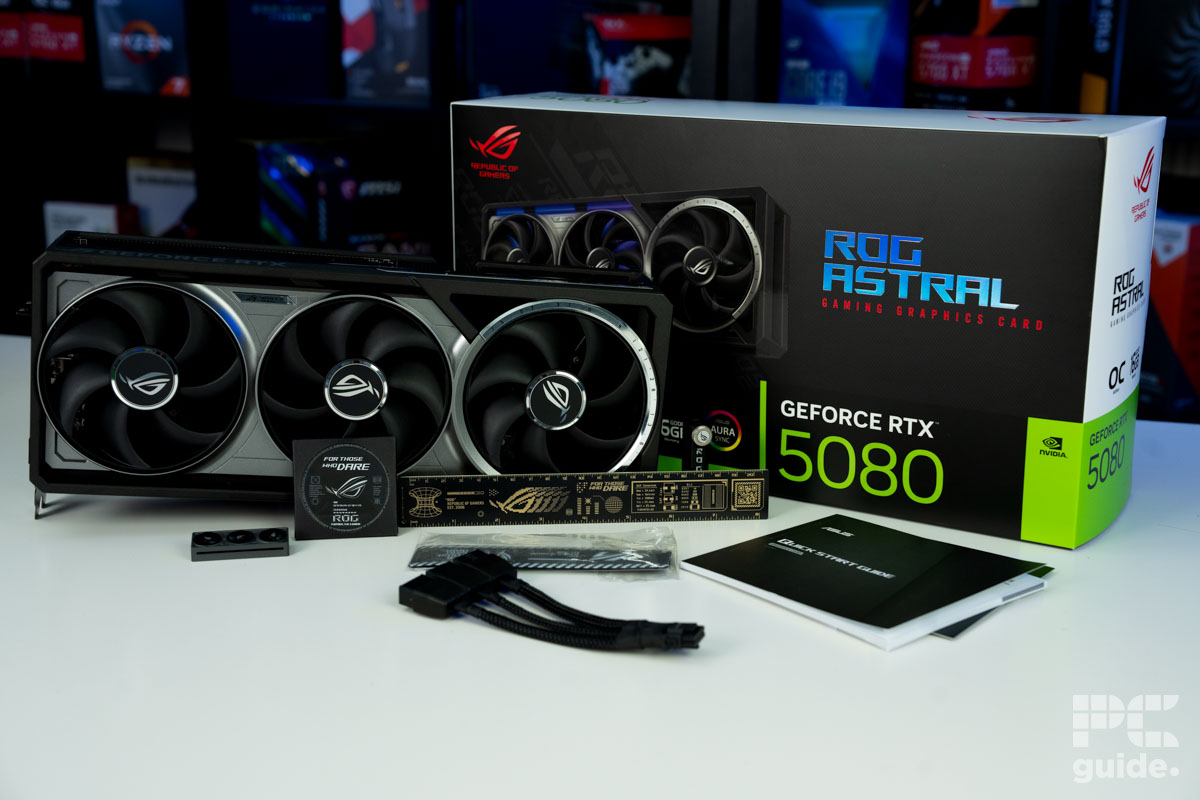
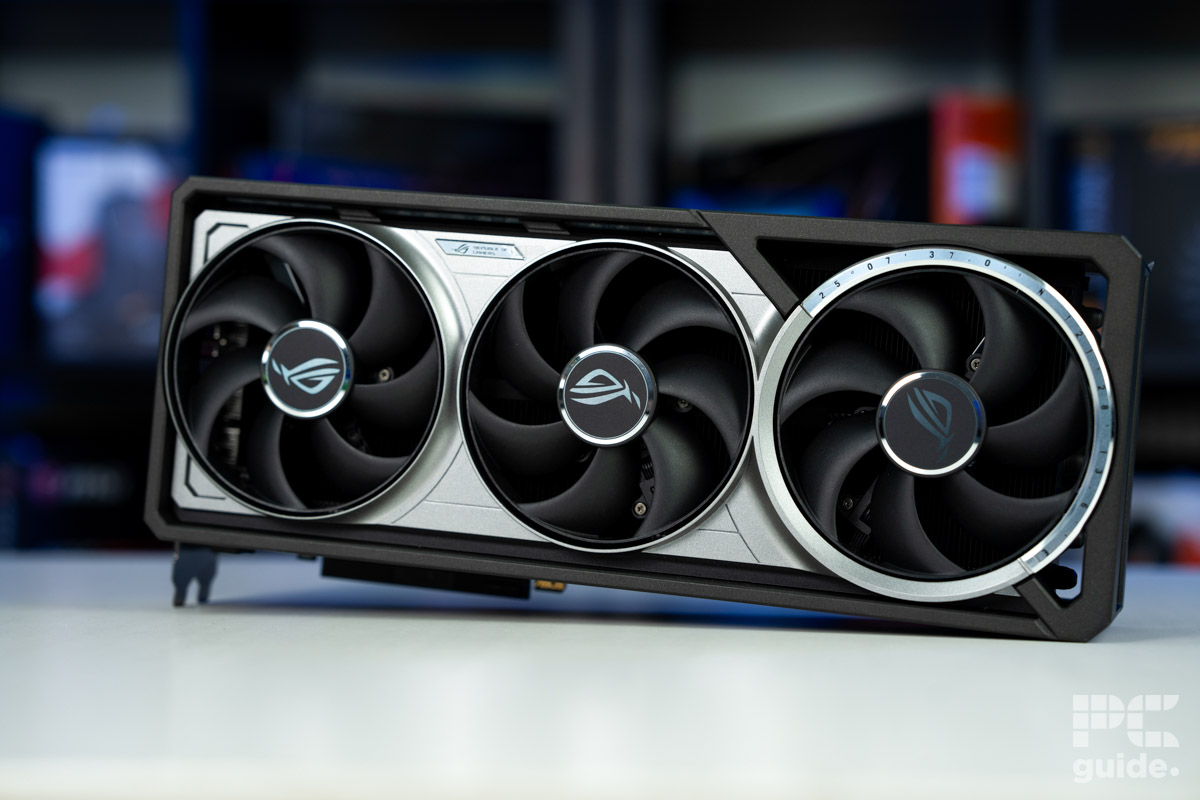
We’ve reviewed both the RTX 5080 Founders Edition and ROG Astral RTX 5080; they offer a high level of 4K gaming performance as you’d expect. On top of that, they also demonstrated a solid uplift in synthetic benchmarks over the last-gen RTX 4080. As part of our reviewing process, we ran 3DMark tests in 4K across Fire Strike Ultra, Time Spy Extreme, Port Royal (RT), and Steel Nomad benchmarks.

Our in-house 4K benchmarks above line up closely with the source from VideoCardz, with a marginal improvement visible from ASUS’s high-end overclocked model. According to the source, the RTX 5070 Ti in these tests is an “MSRP model with Nvidia reference clocks”, so it makes most sense to compare it to Founders Edition. Based on our testing, here’s how that looks:
| 3DMark benchmark | RTX 5080 FE | RTX 5070 Ti | How much slower? |
|---|---|---|---|
| Fire Strike Ultra (4K) | 21,568 | 18,065 | -16.24% |
| Time Spy Extreme (4K) | 16,069 | 13,485 | -16.08% |
| Steel Nomad (4K) | 8,235 | 6,532 | -20.68% |
If you’re wondering about the RTX 5070 (non-Ti), that won’t be coming until early March, and it’s set to go head-to-head with AMD’s new RX 9070 series GPUs. Speaking of which, the RX 9070 XT might actually perform nearly as well as the RTX 4090, so there’s lots to uncover once performance benchmarks go official.
About the Author