AMD Ryzen 9 7900X review – Is it worth it?
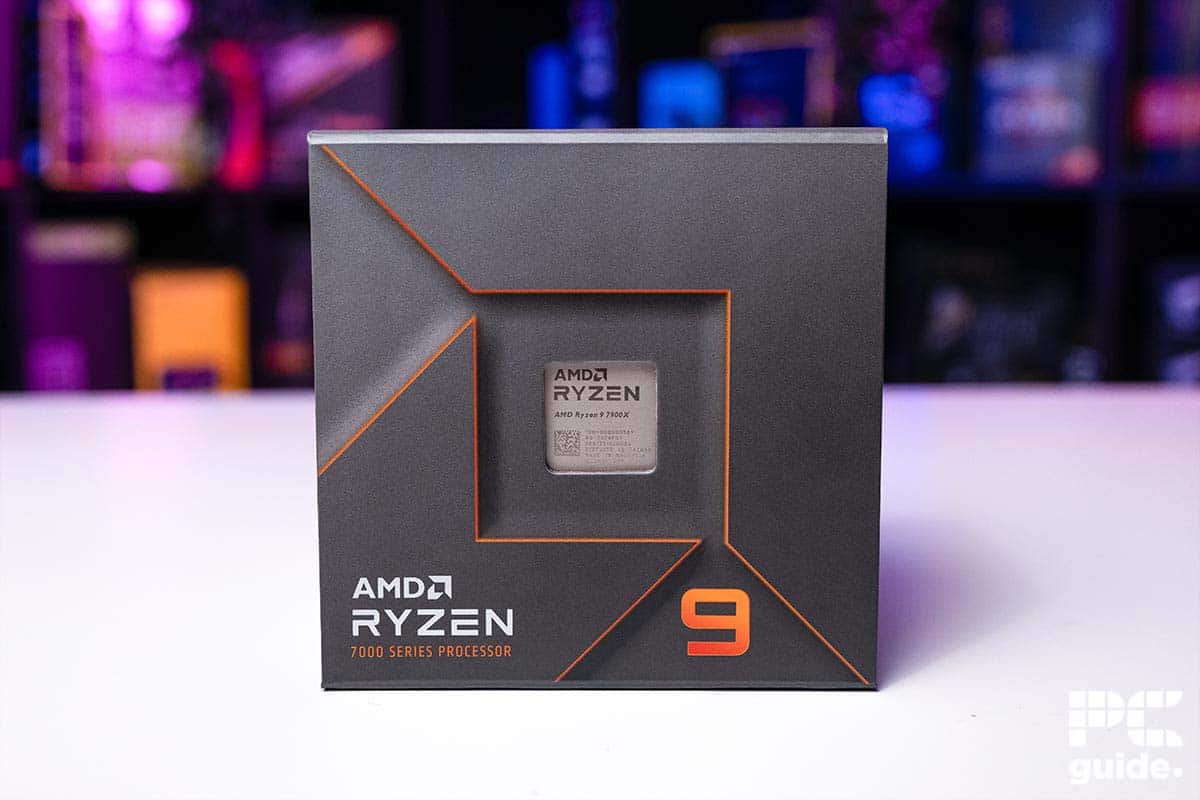
Table of Contents
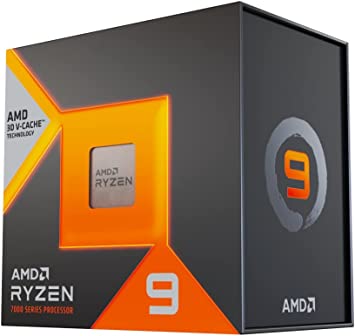
The AMD Ryzen 9 7900X is almost at the top of the non-X3D AM5 class, with only the 7950X beating it in terms of raw performance. Don’t let that put you off though, this CPU is still brimming with potential, especially when you pair it with a good GPU. The 7900X was released in September 2022, which is advantageous and allows us to extract even more value from one of the best AMD CPUs ever made. Here’s our Ryzen 9 7900X review.
The 7900X, well the Zen 4 platform in general makes a lot of improvements over the older generations, such as IPC improvements and cache extensions. As long as you can front the cost of upgrading to AM5, you won’t be disappointed by this 7000 series CPU.
Prime Day is finally here! Find all the biggest tech and PC deals below.
- Sapphire 11348-03-20G Pulse AMD Radeon™ RX 9070 XT Was $779 Now $739
- AMD Ryzen 7 7800X3D 8-Core, 16-Thread Desktop Processor Was $449 Now $341
- ASUS RTX™ 5060 OC Edition Graphics Card Was $379 Now $339
- LG 77-Inch Class OLED evo AI 4K C5 Series Smart TV Was $3,696 Now $2,796
- Intel® Core™ i7-14700K New Gaming Desktop Was $320.99 Now $274
- Lexar 2TB NM1090 w/HeatSink SSD PCIe Gen5x4 NVMe M.2 Was $281.97 Now $214.98
- Apple Watch Series 10 GPS + Cellular 42mm case Smartwatch Was $499.99 Now $379.99
- ASUS ROG Strix G16 (2025) 16" FHD, RTX 5060 gaming laptop Was $1,499.99 Now $1,274.99
- Apple iPad mini (A17 Pro): Apple Intelligence Was $499.99 Now $379.99
*Prices and savings subject to change. Click through to get the current prices.
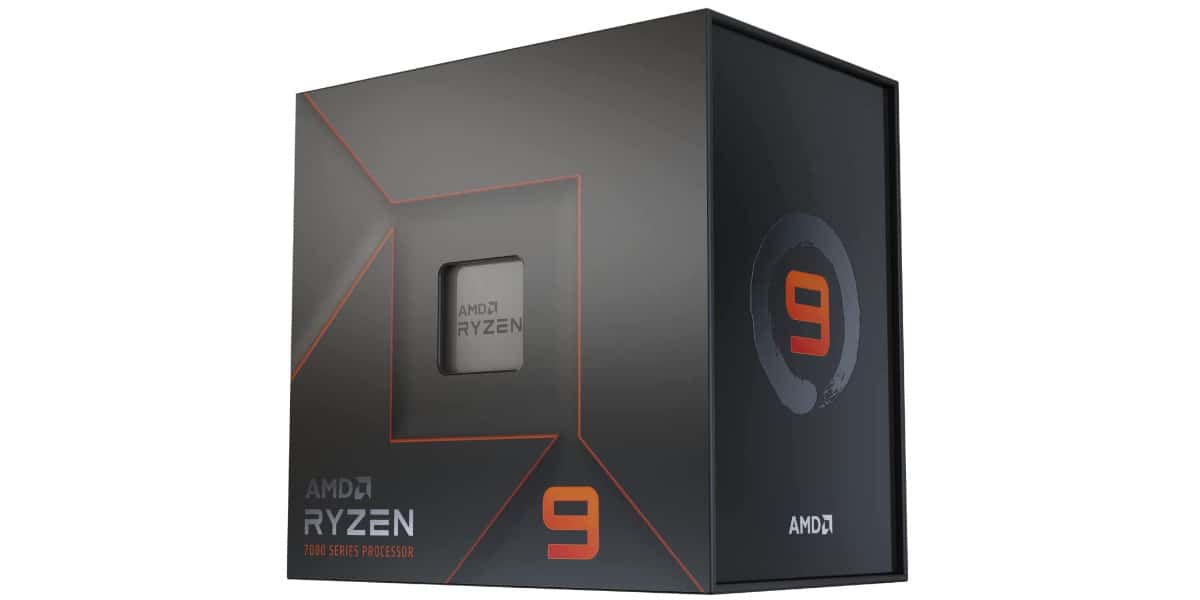

- Cores: 12
- Threads : 24
- Boost clock speed: 5.6 GHz
- Base clock speed: 4.7 GHz
- L3 Cache: 64 MB
- TDP: 170 W
- Platform: AMD Socket AM5
This CPU can work hard, and play hard too. It is just as comfortable gaming as it is in workstation and productivity scenarios, a real jack of all trades, if you will.
- Provides strong multi-core performance whilst remaining efficient
- Age means it can be frequently found on sale
- very future proof as it’s the first generation on AM5
- Strong gaming performance, CPU is able to support even the strongest GPUs when gaming.
- Performance in game is beaten by the 7900X3D
- 7950X provides better multi-core performance for not much more money
- Does not come with a stock cooler
- Does run hot – probably why it doesn’t come with a stock cooler
Why we gave it a 4.5
The 7900X is a great CPU that can be used in a multitude of scenarios, however, if you’re willing to shell out a little more, you can get a 7950X with more cores, more threads, and a higher clock speed.
To cut a long review short, if you’re looking for a high-end CPU that is just as comfortable gaming as it is navigating complex workstation tasks, then this CPU is absolutely for you. The fact that it’s been out for a while now only works in your favor when it comes to snagging one for a great deal. It’s not quite the best you can get on the platform, but it is one of the best value, we’d say second best after the 7600X.
CPU specifications
Before we jump into the performance of this high-end beast of a CPU, we should first take a look at the specifications it holds, to better understand how and why this thing performs. Looking at specifications doesn’t give you a whole picture, but it helps to give you an idea of how well a CPU, or any PC component, will do.
The full specifications of the Ryzen 9 7900X are as follows:
- Cores: 12
- Threads: 24
- Base clock speed: 4.7GHz
- Boost clock speed: 5.6GHz
- L2 Cache: 12MB
- L3 Cache: 64MB
- TDP: 170W
- Socket: AM5
- iGPU: RDNA 2 based Radeon Graphics
As you can see, the 7900X can hold its own on paper. It has 12 cores and 24 threads at its disposal all capable of reaching 5.6GHz when the computer needs the power. Despite all that, the CPU only has a 170W TDP, which is more efficient than equivalent Intel CPUs. Efficiency is the name of the game when it comes to AMD, you need only glance at the PPW to confirm.
IPC is increased across the board with the Ryzen 7000 series, IPC stands for instructions per clock, and it essentially means that AMD has managed to pack more transistors into the CPU, allowing for more “decisions” made per core cycle. We outlined the importance of IPC in our 7600X review, so if you would like a greater understanding, feel free to read the definition there.
IPC is the invisible metric that determines CPU performance
IPC isn’t listed on any specs sheet, but it makes a huge difference in how a CPU performs. The 7000 series is based on 5nm architecture, and the 5000 is based on 7nm. This means the transistors are smaller on the 7000 series, allowing AMD to use more of them in the same footprint.
Lets say you can get 1000 transistors in the 5000 series, and 1500 in the 7000 series (because they are smaller in the 7000 series)
A CPU running at 5GHz with 1500 transistors will likely be better than a CPU running 5.3GHz with 1000 transistors, even though it looks the other way around on paper.
The actual numbers are much higher, this just serves as a very crude example
Performance
With that understanding, we can move on to the performance of our 7000 series AMD CPU. We tested our CPU on a test bench comprised of the latest no-compromises hardware to give it the best chance. We’re going to outline the hardware we used below, so you get an idea of where all the gaming performance comes from. Your results may vary on your hardware, even if you use the same CPU.

The components used on the benchmarking rig are as follows:
| Component | Name |
| GPU | RTX 4070 Ti Super |
| Memory | Corsair Vengeance DDR5 @ 6400MHz |
| Motherboard | ASUS ROG Crosshair Extreme X670 |
| CPU cooler | Corsair Elite LCD Capellix 360MM |
| Power supply | ASUS ROG Thor 1000W |
| Case | Cooler Master Masterframe |
We always use the same components on our test bench wherever possible to eliminate any variables skewing our performance metrics. This isn’t possible with Intel CPUs as they use a different motherboard, but we try and use one that is comparable in terms of speed and features.
Synthetic benchmarks

So you’ve made it this far, to the synthetic benchmarks. We tested the 7900X in a multitude of different synthetic benchmarks, these tests are designed to determine the CPU performance in a variety of different workloads. We have benchmarks from CPU-Z, 7-Zip, Puget systems, and more, All designed to give the widest possible spread to encompass almost all use cases.
Here’s how our Ryzen 7000 CPU performed in our synthetic suite:
| Benchmark | Score |
| CPU Z Single | 778 points |
| CPU Z Multi | 11,614 points |
| Cinebench R23 Single | 2,017 points |
| Cinebench R23 Multi | 28,006 points |
| Geekbench Single | 3,065 points |
| Geekbench Multi | 18,374 points |
| Puget Systems photoshop | 9,033 points |
| Blender render | Monster 184.52 SPM Junkshop 131.31 SPM Classroom 95.03 SPM |
| 7 Zip Compression 32MB (10 passes) | 49.687s |
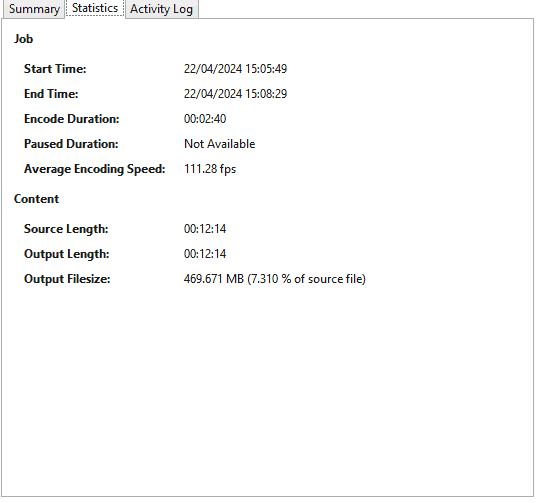
| Handbrake TOS 4K Fast 1080P encode | Average Speed 111.28 FPS Encode Time 2:40 |
We have quite a suite of benchmarks on which we tested our AMD CPU, and we must say that the numbers that came out of it are pretty impressive.
CPU-Z
CPU-Z is a long-standing staple and we use it as a baseline for all CPU tests we do because there’s so much data available. The 7900X is very close to the 7600X in terms of single-core CPU performance, as the 7600X scored 766 points. Our CPU manages to pip that at the post with 778 points. This will be thanks to the improved core boost speed the 7900X possesses. But obviously, it dominates in multi-core workloads, as it has double the cores available.
Cinebench
Cinebench takes your CPU and assesses its ability to render a complex image, you may be familiar with the distinct table and chair render that Cinebench uses. On the scoring front, our Ryzen 7000 series CPU scored 2,017 and 28,006 points respectively, which is a very high score in terms of Cinebench. According to the Cinebench database, where you can compare the best performance of every CPU tested on the software, our stock 7900X manages to beat the best averages of the Ryzen 9 7900X3D, and the 12900K.
These are the best of the best
Cinebench scores in the database are verified averages of best scores, they don’t represent the typical score you’re going to see on a standard system. So if it looks like your CPU is underperforming slightly, it probably isnt.
Geekbench
Geekbench is kind of a jack-of-all-trades benchmark, it tests things like compression to machine learning, and it has everything covered. Our Ryzen CPU scored well in the Geekbench tests, achieving a score of 3,065 and 18,374 in the single and multi-core benchmarks. Again, referring to the Geekbench database, we can see that the 7900X is directly comparable to the Core i9-14900F in multi-core performance. That puts our CPU on par with the flagship SKU from Intel’s lineup (well, it’s the locked F version, but we’re still counting it).
Puget Systems Photoshop

The new Puget Systems benchmark we included tests a CPU’s proficiency in video editing, it tests everything from loading RAW files, to resizing them, to filtering applications, and more. It’s really interesting stuff. This test is run 3 times and a score is produced at the end of the benchmark based on how well the CPU did. Our CPU happened to bring home a score of 9,033 points. Which is around 1,000 more than the 7600X got.
Why does a CPU that has 2x the cores and threads not perform 2x better?
Considering the 7900X is twice the CPU that the 7600X is, why does it not perform twice as good? Well, in situations like these, its not always about how many cores you have, its about the speed of those cores.
While workloads like this do favour multithreaded performance, the cores still operate at their maximum speed (or less if it can’t get an all core speed) not to mention the fact that threads aren’t real, they’re just the ability to process more than 1 instruction simultaneously to the original instruction, and the fact a thread has to share resources with the core which IS real and get PRIORITY of any resources.
But when core speed isn’t a factor, it will likely perform close to 2x better.
It’s complicated.
Blender

Blender tests your CPU’s rendering performance, and it does so in three main tests. 3D renders can be quite complex, filled with simulated lighting and polygons. Usually, it’s the GPUs that chew through this workload, as GPUs are great at linear number crunching, but we want to CPUs to suffer.
We’re going for the SMP (samples per minute) higher is better. Our AMD CPU scored 184.52 SPM in the monster render which we noted in our 7600X review as almost twice the score of the 7600X (87.03 SPM). This leads us to believe that in workloads such as rendering, it’s the number of cores you have that directly relates to performance. Sure, core speed will help, but if you need a rendering machine, you should go for higher cores. Or just get a GPU to do all the work, to put it into perspective, our RTX 4070 Ti Super manages 3726 .61 SPM in Monster. So, yeah.
7-Zip Compression test (10 passes)

7-Zip is the best archive tool in an alternate reality where nobody invented Winrar. Thankfully, 7-Zip has a benchmarking tool, so we do actually like it for once and we aren’t joking about it. 7-Zips benchmark tool compresses and decompresses a 32MB package 10 times to determine how good a CPU is at that particular task. The Ryzen CPU we have managed to get all 10 passes done in 49 seconds. 4 seconds slower than the 7600X.
Handbrake Tears of Steel 4K encode
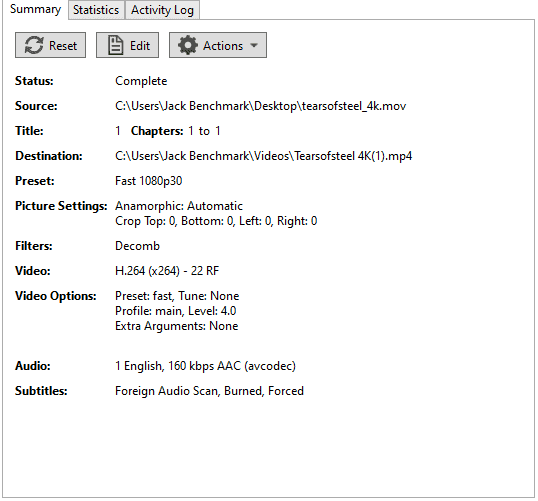
Handbrake is a video encoder at heart, and there’s a standardized test the CPU community uses that utilizes Handbrake. Using a preset to test the CPU performance, we encode a 6GB short film, Tears of Steel. The 7000 series Ryzen CPU we have manages to achieve an average encoding speed (AES) of 111.28 FPS and only took 2:40 to complete. For comparison, the Ryzen 5 we tested performed about half as well, fitting since it has half the cores.
Real-world gaming benchmarks
It wouldn’t be a CPU benchmark without a few games thrown in, we tested the 7900X in 2 games only, because we just can’t get enough of those productivity benchmarks. All of the games are tested in 1080P low settings, to ensure we aren’t limited by GPU performance. Remember that your miles may vary, and your FPS values will likely not match ours unless you have the same hardware.
Here are the results of the Real-world benchmarks:
| Game | Result |
| Days Gone | 276 FPS / 1% 84 FPS |
| Cyberpunk 2077 | 299 FPS / 1% 128 FPS |
As you can see, pretty smooth sailing from our Ryzen 9, which is clearly more than capable of handling games in 1080P.
Days Gone
Days Gone is an open-world RPG that has been known to hog a resource or two, making it the perfect opportunity for the 7900X to spread its wings. Our CPU scored an average FPS of 276, and 1% lows of 84 FPS. Even the stutters are over 60 FPS. Not a bad problem to have if you ask me.
Cyberpunk 2077
CP 2077 as we all know isn’t the most optimized game in the world, although it has become much more playable over the years thanks to the efforts of the dev team. This game is known to be pretty CPU intensive so we made sure to include it in our gaming benchmarks, Our Ryzen 9 scored an average FPS of 299, and a 1% low of 128. That puts the 1% lows a little behind the 7600X, but that could be down to a multitude of different issues.
All in all, the 7900X is a perfectly capable gaming machine, when you pair it with the right GPU.
Price
Our little Ryzen 9 was released in September 2022 at the retail price of $549 (spits out coffee), but thankfully, that was a long time ago and the CPU can now be found for around $410. If you’re lucky you can catch it even lower during big sales events. According to Camelcamelcamel, an Amazon price tracker, as of the time of writing this review, the lowest the 7900X has ever been was August 2023 at $349.99.
What do these benchmarks mean?

We use synthetic benchmarks to understand how well the CPU will do in day-to-day or productivity scenarios. We designed our test suite to cover the widest use case we possibly could. Speaking in general terms, a higher points score and higher FPS are better, but when it comes to times, lower is usually better – unless stated otherwise.
Using these benchmarks to extrapolate the general performance of our Ryzen friend. The performance is akin to the Core i9 14900F, which is a whole generation ahead of the 7900X. Not too shabby if you ask us. In gaming, the 7900X is a powerhouse that won’t run out of steam anytime soon. However, if you want a Ryzen CPU for pure gaming workloads, we recommend a 7900X3D.
Alternatives to the Ryzen 9 7900X
As always, it depends on your use case, and whether you’re supporting Team Red or Team Blue. But we have a couple of recommendations for any scenario.
-
AMD Ryzen 9 7900X3D
- Cores: 12
- Threads: 24
- Boost clock speed: 5.6 GHz
- Base clock speed: 4.4 GHz
- L3 Cache: 128MB
- TDP: 120W
-
If you’re into purely gaming workloads, and you have your heart set on AM5 and all the features it brings, you might be better off considering the 7900X3D. Its 3D V-cache allows this CPU to excel in games that can fully utilize the cache it is presented. In gaming benchmarks, the 7900X3D rockets ahead of the 7900X.
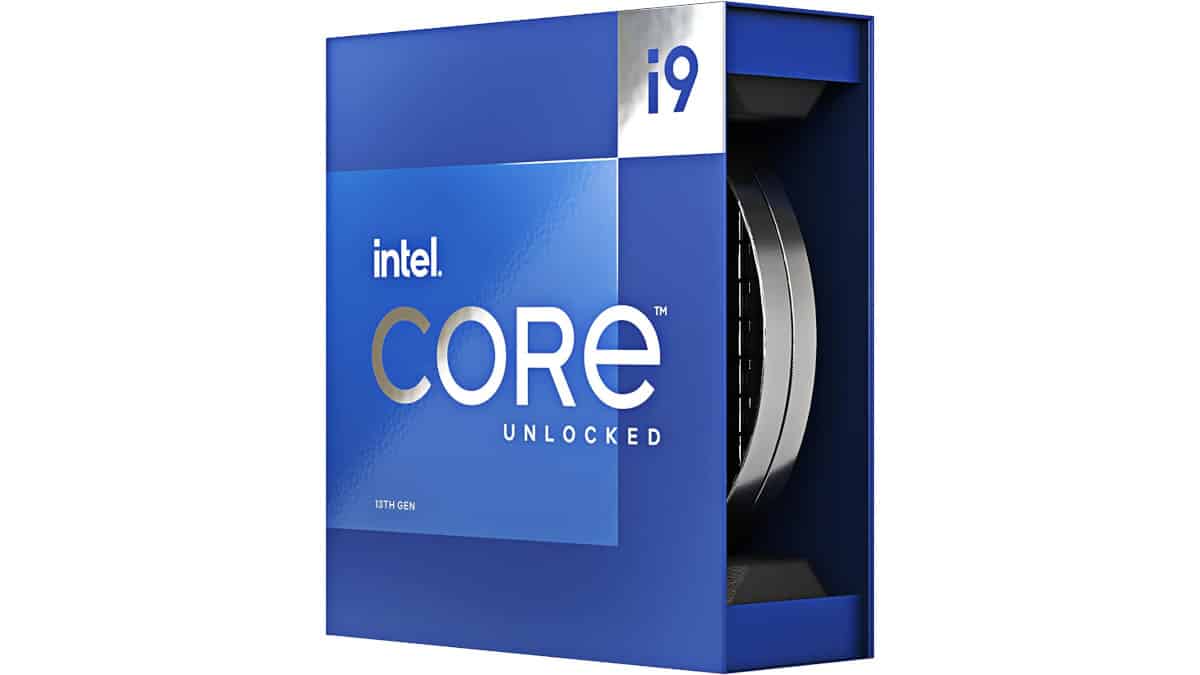
If you want to decorate your PC with some blue, then the Intel Core i9-13900K may be for you. It belongs to socket LGA 1700, which is a couple of generations old now, making it more likely to find one for a decent price. It’s not cheap upgrading to AM5 you know. The 13900K is praised for it’s big.LITTLE architecture, affording a lot of power with relative efficiency.
Is upgrading to AM5 worth it?
AM5 currently only has 1 generation of CPUs that use the socket, and that is the Ryzen 7000 series. That means that you’re not likely to just have one unless you already own a 7000 series CPU. This is where LGA 1700 from Intel has a slight advantage.
AM5 is still pretty expensive if you want the cutting-edge, but do you want to upgrade? AM5 offers support for PCIe gen 5 on both storage and GPU (on the X670 chipset) which will, naturally, set you back the most. This is handy if you want your PC to boot fast and remain future-proof if the next generation of GPU decides to up its bandwidth requirements.
AM5 is pretty pricey, it’s not just the motherboard that you have to consider, you need DDR5 memory, as AM5 doesn’t currently have any DDR4-compatible AM5 motherboards, and you need the CPU itself. So bear that in mind when you come to upgrade.
If you can upgrade, you should upgrade. AM4 is fantastic, but it’s not getting any younger.
Conclusion


- Cores: 12
- Threads : 24
- Boost clock speed: 5.6 GHz
- Base clock speed: 4.7 GHz
- L3 Cache: 64 MB
- TDP: 170 W
- Platform: AMD Socket AM5
The Ryzen 9 7900X is the CPU to have if you’re looking for productivity on the AM5 platform. This Ryzen 9 CPU smashed through our benchmarks displaying that kind of AMD power and perceverance that we all have come to love from the brand. This CPU is still pretty expensive, and it’s still not the cheapest to upgrade to AM5 with the cost of DDR5, but well worth the performance increase if you can afford it. This was our AMD Ryzen 9 7900X review.


