How to calculate z-score in Excel – step-by-step guide

Table of Contents
Are you wondering how to calculate z-score in Excel? If so, you’ve landed on the right page.
In statistics, a z-score tells us how far a data point is from the mean. While Excel still doesn't have an automatic formula for calculating a dataset’s z-score, we can use other Excel formulas to calculate the mean and then the standard deviation.
The entire process may sound complicated, so we’re here to explain it to you through our step-by-step guide!
What is a z-score?
A z-score is a significant statistical measure often used to interpret raw data. To calculate the z-score of a dataset, you need the following calculations:
- X = The value that needs to be standardized. In simple words, the data point.
- µ = Mean of the dataset.
- σ = Standard deviation of the dataset.
This is the formula for calculating the z-score:
z = (X – μ) / σ
Calculating z-score in Excel
Scenario on hand: We have an Excel dataset with the weights of chip packets in a production line.
What we want to accomplish: In our article, we will work with a sample dataset of packet weights to calculate the z-score for each entry in the dataset.
By calculating the z-score, the manufacturer can ensure that the machine is filling the chip packets within the desired range. We will also identify outliers in the dataset based on the z-score to show how the z-score helps identify issues in production lines.
Here are the steps we will follow in this article:
- Arranging the data
- Creating the helper cells
- Calculating the helper cells
- Calculating the z-score
- Interpreting the z-score
Step 1: Arranging the data
The first step is arranging the data so that all the data points are in a vertical column. Although the data doesn't have to be labeled to calculate the z-score, it is a good practice to label your data so that your worksheet looks professional and neat.
Here is a picture of the data set we will be using for this example:
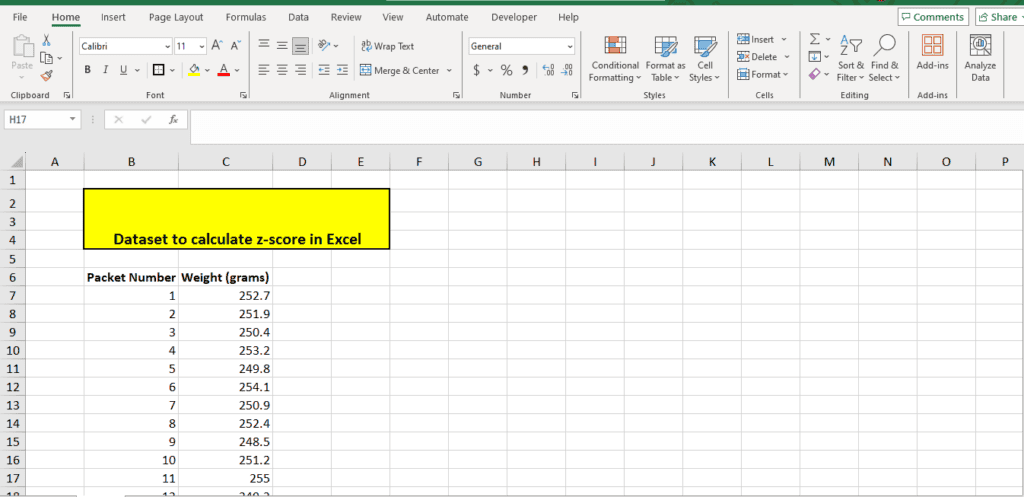
In this data set, we have 20 data points. These data points refer to the weight in grams of 20 packets of chips in a filling line.
Step 2: Creating the helper cells
To calculate the z-score, you need to calculate the μ and σ or the mean and standard deviation of the dataset. These two will be the helper cells for calculating the z-score for each data point.
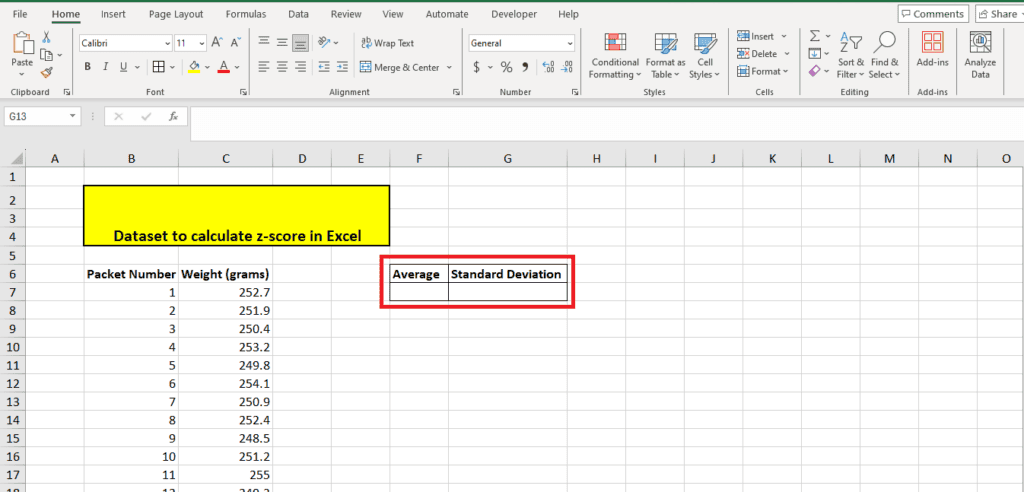
In this demonstration, we will calculate the mean and standard deviation using the formulae available in Excel. Before that, we need to create the helper cells named Average and Standard Deviation.
Step 3: Calculating the helper cells
Now that you're labeled the helper cells, add the formula under or beside each cell to calculate the referred values.
How to calculate the mean
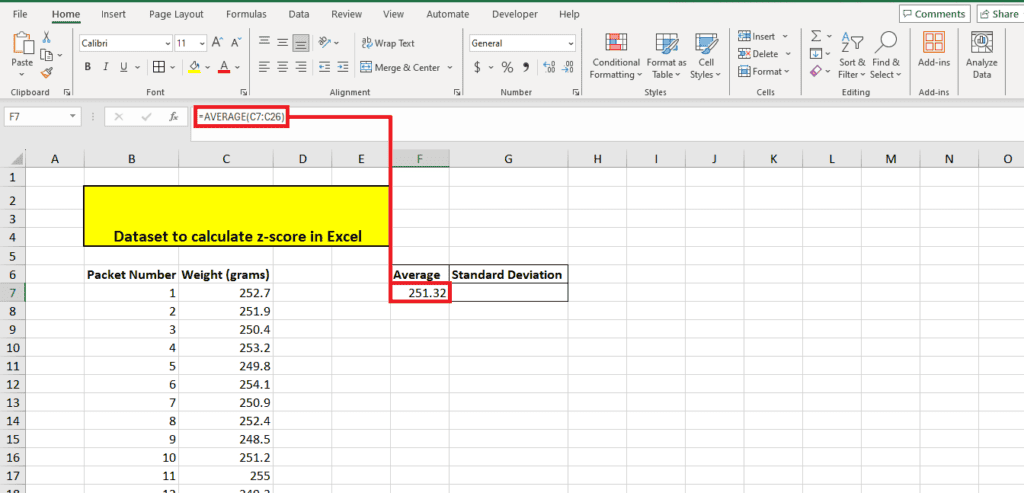
Under the cell named ‘Average,' calculate the mean using the syntax:
=AVERAGE(<data range>)
For our dataset, here's the formula:
=AVERAGE(C7:C26)
Here's the formula in action:
How to calculate the standard deviation
Under the cell named ‘Standard Deviation,' calculate the standard deviation using the syntax:
=STDEV.S(<data range>)
For our dataset, here's the formula:
=STDEV.S(C7:C26)
Here's the formula in action:
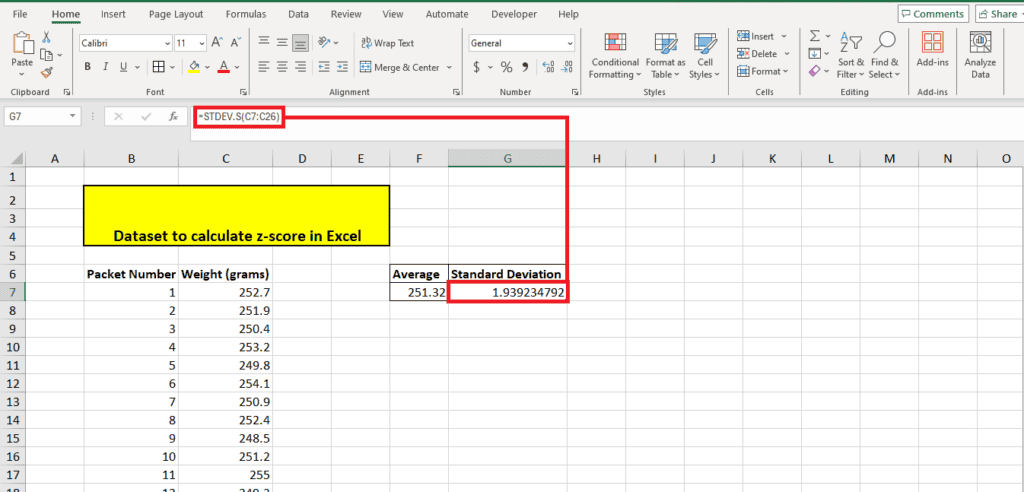
Note: We used the formula STDEV.S here because our dataset includes weights for just 20 pieces from a larger population.
For instance, if our dataset had the heights of the entire class (the entire population), we would have used the formula STDEV.P to calculate the population standard deviation.
Step 4: Calculating the z-score
Now that we have the helper cells ready, let's get on to calculating the z-score. For this, we first add the column z-score beside the column with the data points like this:
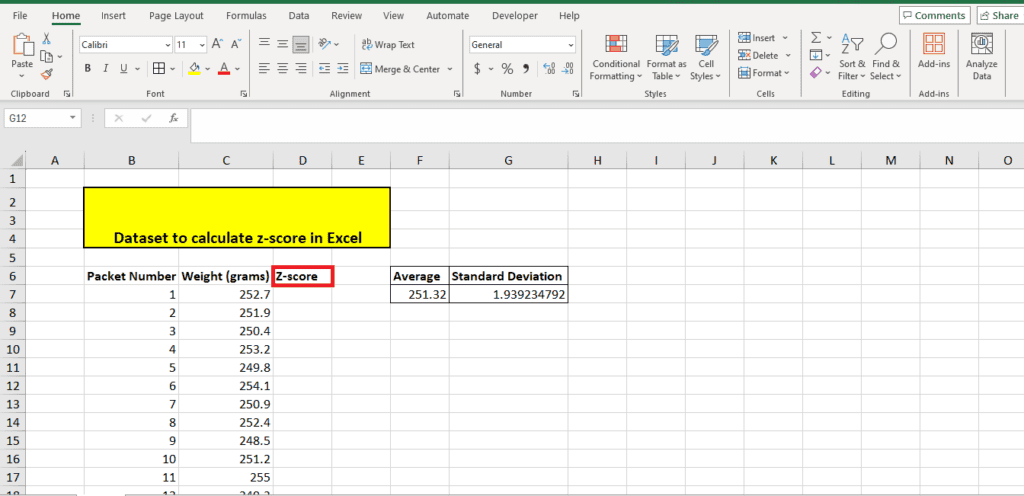
There are two ways we will use for calculating the z-score. The first syntax is formula-based:
=(<datapoint>-<group mean>)/<standard deviation>
Here's the formula in action for the first data point in our dataset:
=(C7-F7)/G7
Here's the value we get by inputting this formula:
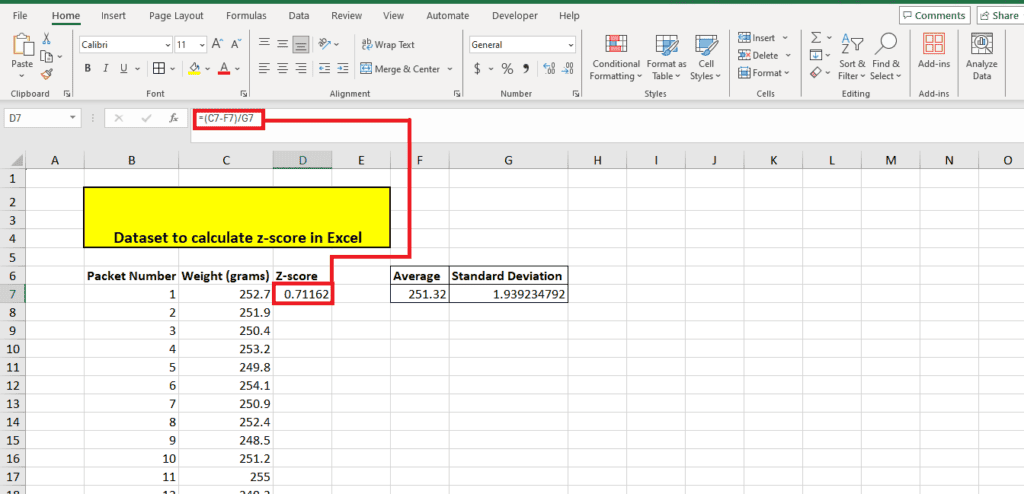
The second syntax uses the Excel function STANDARDIZE. Here's the syntax for this function:
=STANDARDIZE(<Cell address of data point>, <Mean> , <Standard Deviation>)
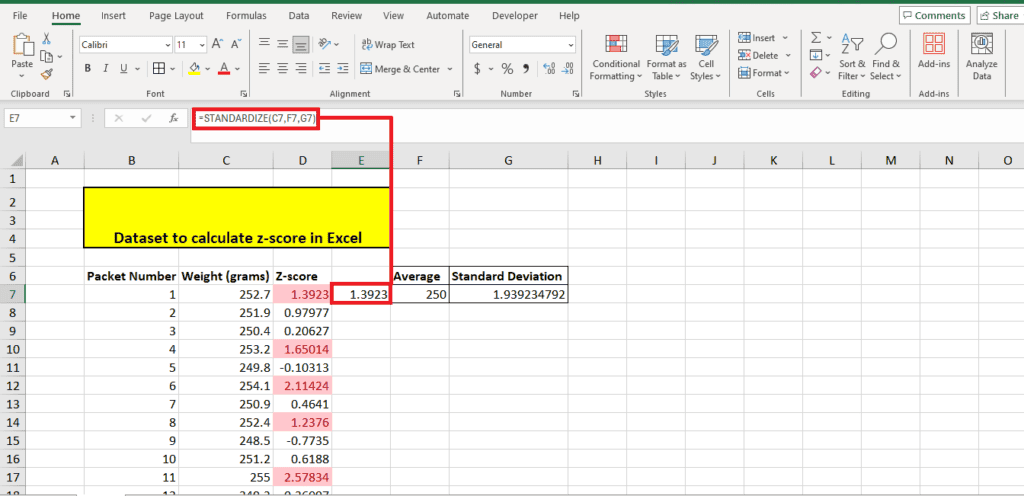
Here's the formula in action:
=STANDARDIZE(C7,F7,G7)
This formula also requires calculating the mean and standard deviation separately. So, it is not an automatic calculation of the Z-score and will yield the same result as the formula.
Here's a screenshot of the value this function returns.
Step 5: Expanding the formula
We have now calculated the z-score for the first data point. To calculate the z-scores for the other points in the table, we could write the formula again and again. However, this would be too time-consuming and highly susceptible to human errors. So, use a neat trick to expand the formula to the rest of the table.
Start by adding $ signs to the cell addresses of the sample average and the sample standard deviation. Here's how we modify our first cell:
=(C7-$F$7)/$G$7
You will see that adding the $ sign doesn't have any impact on the calculation. What this $ sign does is give absolute references to the fixed cells: average and standard deviation.
Now, we will use the Fill Handle Tool to expand the formula to the rest of the column’s values.
To use the fill handle tool, move your cursor to the bottom right corner of the cell with the formula. Doing this will turn your cursor into a + sign.
Click the left mouse button when you see this sign and drag it to the bottom of the table. Here's how it looks:
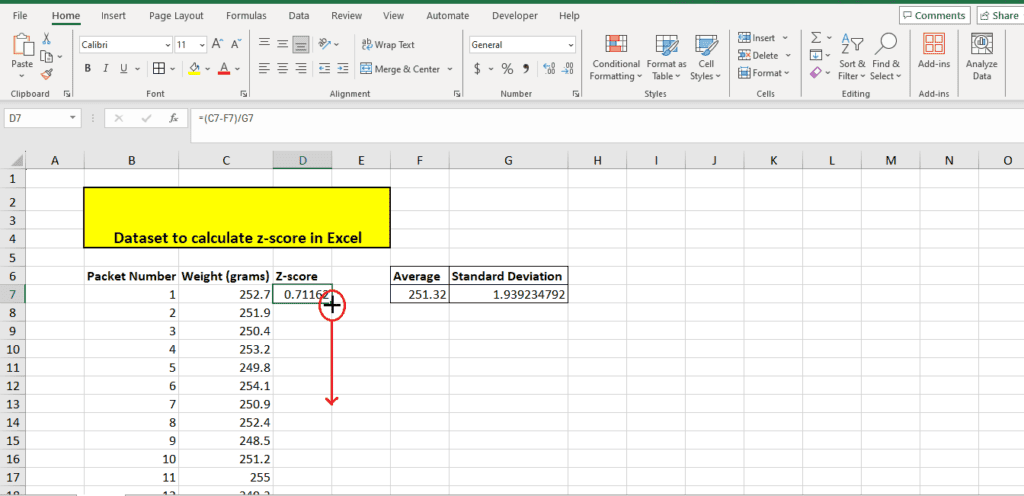
When you drag the formula down the table using the Fill Handle tool, it automatically calculates the values for the rest of the data points in the table.
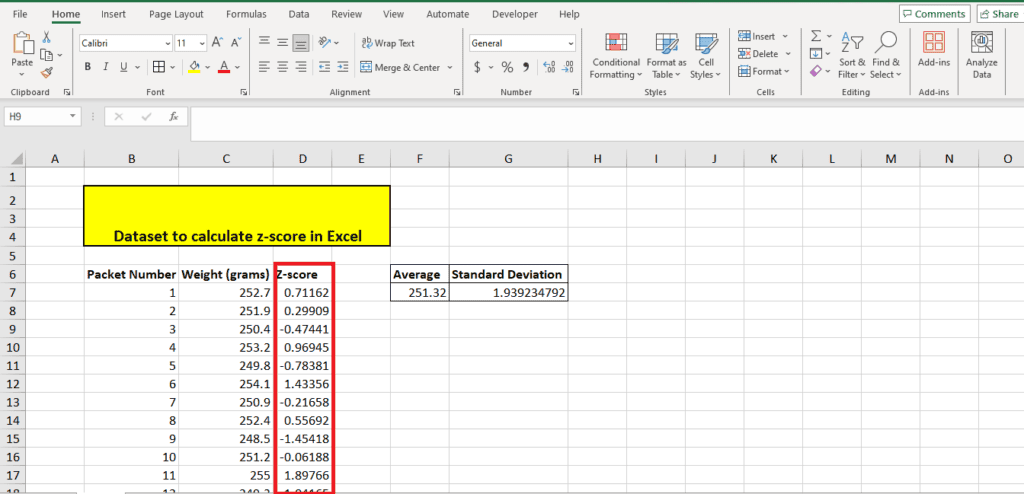
Here's what our completed table looks like:
Step 6: Interpreting the z-score
Now that you've learned how to calculate the z-score let's learn how to interpret it.
First, let's understand what the z-scores mean. The z-score could be zero, positive, or negative. A negative z-score indicates that the value is lesser than the mean. A positive z-score means that the value is greater than the mean. The value of the z-score indicates how far away from the mean it is. A zero score means that the value is at the mean.
Scenario-based interpretation
In our scenario, the production company intends to put 250 grams of chips in every bag with a variance of 2 grams. So, the acceptable weight of the packet is between 248gm and 252gm.
In our scenario, our average is 251.32 grams. Ideally, this should be 250 grams. So, for the purpose of interpretation, we have replaced the average with 250. Because the z-score column was calculated using the average, these values also change:
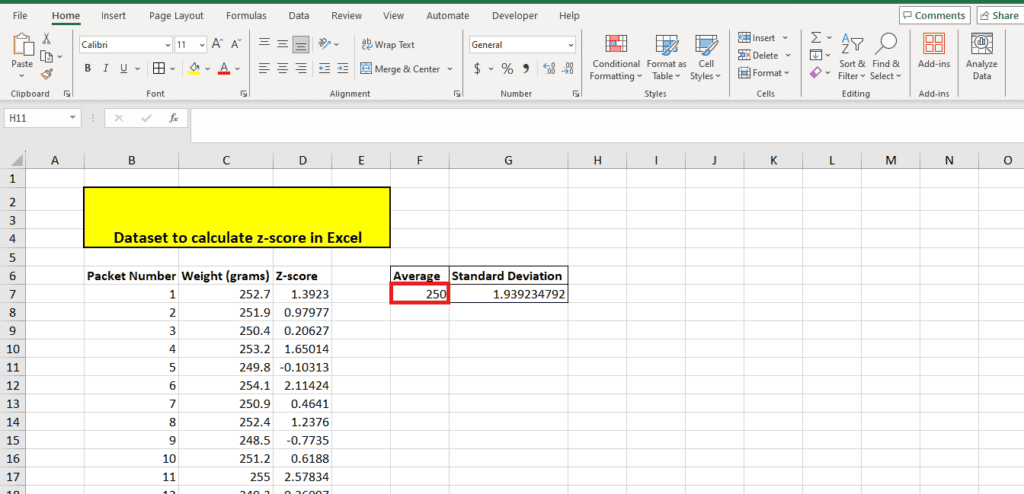
The standard deviation is 1.93 grams, which is close to the ideal 2-gram standard deviation we need. To mark z-scores that are out of range, we need to specify rules to mark z-scores that exceed +1 or are lower than -1.
- +1 means that the weight is 1.93 grams or 1 standard deviation greater than the mean or 250+1.93 grams.
- -1 means that the weight is 1.93 grams or 1 standard deviation less than the mean or 250-1.93 grams.
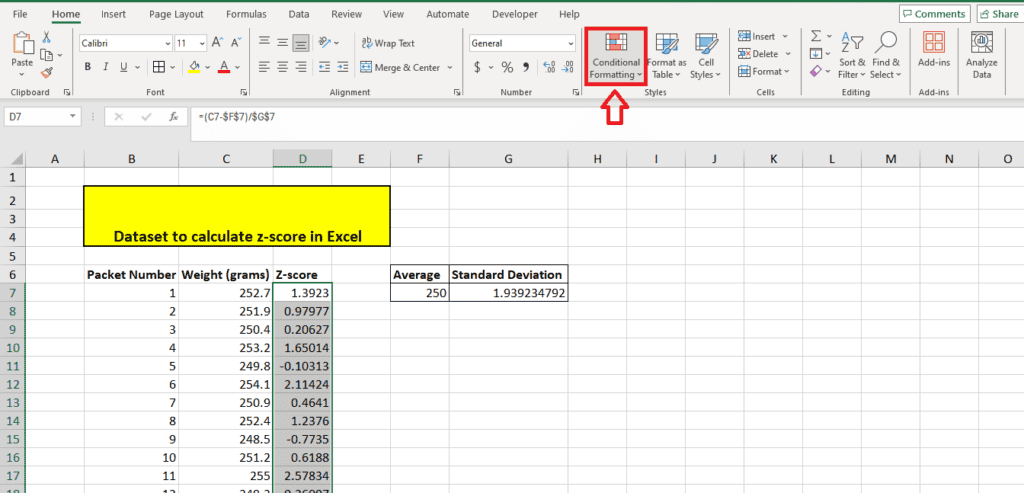
To mark the cells, select the z-score column, then use Conditional Formatting to specify cell rules. You will find the Conditional Formatting option in the Home tab:
Specify the lower limit
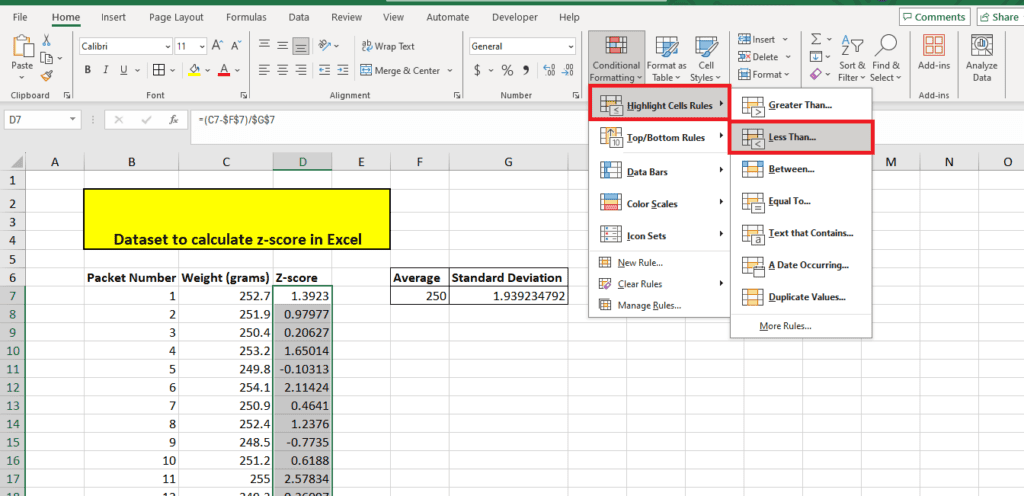
For specifying the lower limit, choose the conditional formatting option Less Than:
Here's the input window where we specify -1 as the lower limit:

Specify the upper limit
For specifying the upper limit, choose the conditional formatting option Greater Than:
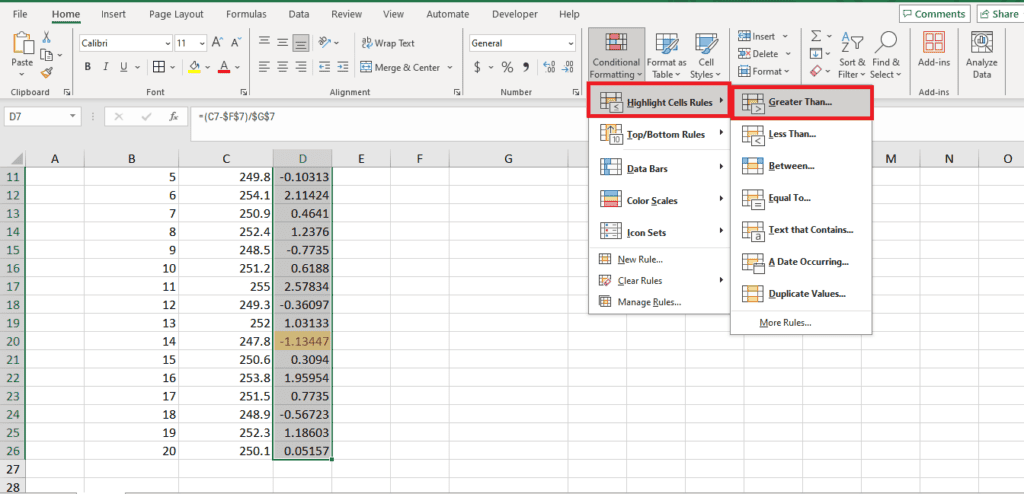
Here's the input window where we specify 1 as the upper limit:

In our dataset, 9/20 data points, or 45% of the sample, exceed the upper limit or are lower than the lower limit. That means that the machine is performing poorly and needs to be recalibrated to get more accurate filling in the packets.
What is the formula for the Z score in Excel?
The formula for calculating z-score in Excel is: =(x-mean)/standard deviation, where x is the value in the dataset, the mean is calculated using the AVERAGE function, and the standard deviation is calculated using the STDEV.S or STDEV.P
How to use the standardized function in Excel?
The STANDARDIZE function in Excel is a simple way to calculate a dataset’s z-score. For the right calculation, input the value, dataset average, and dataset standard deviation in the formula.
Wrapping up
In our article, we explored a real-life scenario to understand how to calculate and interpret z-scores. We first explained what z-scores are, what the two values we need to calculate them are, and how you can calculate the values and z-scores in Excel.
If you want to learn more about Excel, give these guides a read:
